1. 코드
%matplotlib inline import pandas as pd import seaborn as sns
1. 그룹별로 count 해서 내림차순 정렬하기
occupations_df.groupby('occupation').size().sort_values(ascending=False)
2. barh (가로 막대그래프)
occupations_df.groupby('occupation').size().plot(kind='barh')
3. pie (원그래프)
occupations_df.groupby('occupation').size().plot(kind='pie')
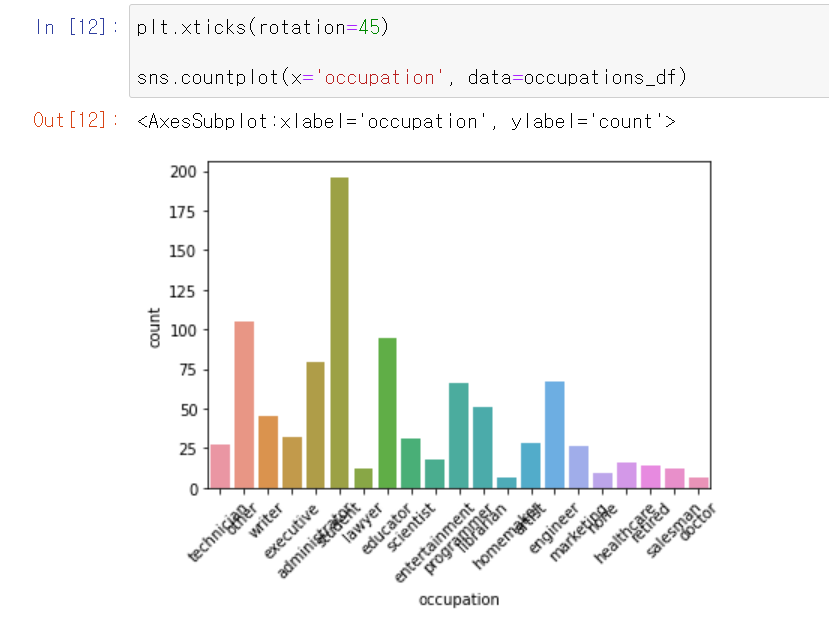
4. countplot + 항목 이름 45도 기울여서 나타내기
plt.xticks(rotation=45) sns.countplot(x='occupation', data=occupations_df)
5. lineplot
sns.lineplot(x='occupation', y='age', hue='gender', data=occupations_df)seaborn.lineplot — seaborn 0.11.1 documentation
How to draw the legend. If “brief”, numeric hue and size variables will be represented with a sample of evenly spaced values. If “full”, every group will get an entry in the legend. If “auto”, choose between brief or full representation based o
seaborn.pydata.org
6. relplot
sns.relplot(x='age', y='occupation', hue='occupation', data=occupations_df)seaborn.relplot — seaborn 0.11.1 documentation
How to draw the legend. If “brief”, numeric hue and size variables will be represented with a sample of evenly spaced values. If “full”, every group will get an entry in the legend. If “auto”, choose between brief or full representation based o
seaborn.pydata.org
2. 발견한 인사이트
1. 'student'(196)가 가장 많고, 'other'(105), 'educator'(95), 'administrator'(79), 'engineer'(67), 'programmer'(66) 순서로 많음 -> 시각화


-> countplot을 이용할 경우 바로 그래프로 나타낼 수 있음

2. 성별 직업 분포를 나타내었지만 알아보기 힘듦

-> 성별 새로운 데이터프레임을 생성해 그래프로 나타냄
-> 남녀 모두 student가 가장 많았고, 남성은 student, other, educator, engineer, programmer가 그다음으로 많았으며, 여성은 other, administrator, librarian, educator, writer가 그다음으로 많았음

3. 직업별 평균 나이는 retired가 가장 많았고, student가 가장 적음을 알 수 있음

+ 직업별 나이 분포

3. 한 줄 평가
- 원그래프로 나타낼 경우 항목명이 겹쳐 보이지 않는 경우에 해결방법을 알고 싶음 + 항목별 퍼센트나 값을 나타내는 방법도 알고 싶음

- 직업별 성비를 아래 방법으로 구해보려고 했으나 에러가 발생함(??)
occupation_group = occupations_df.groupby('occupation') occupation_group occupations_df.loc[occupations_df['gender'] == 'M', 'gender'] = 0 occupations_df.loc[occupations_df['gender'] == 'F', 'gender'] = 1 occupation_group.mean()['gender']
cf. pie 그래프 텍스트 겹치지 않게 하는 방법
[파이 차트(Pie chart)] 8. Matplotlib을 이용하여 파이 차트 꾸미기 - 라벨/텍스트 겹치지 않게 만들기
안녕하세요~~ 꽁냥이에요. 파이 차트를 그리다 보면 비율이 작은 데이터가 여러 개 있는 경우에, 다시 말하면 파이의 간격이 좁은 경우에 텍스트를 표시하게 되면 아래와 같이 글자가 겹쳐서 알
zephyrus1111.tistory.com
cf. seaborn 그래프
파이썬 seaborn 그래프 그리기 - 박스플랏, 히스토그램, 카운트플랏, 산점도, 라인그래프
이전 포스팅에서 R의 ggplot에 대해서 다룬 적이 있다. 처음에는 ggplot의 문법이 어색했지만, 구조를 알고 나니 이해하기가 쉬우졌고 괜찮은 문법이라는 생각이 들었다. 파이썬에는 여러가지 시각
tariat.tistory.com
'DA' 카테고리의 다른 글
| #19. survey.csv (0) | 2021.07.22 |
|---|---|
| #18. parks.csv (0) | 2021.07.22 |
| #16. museum_1.csv / museum_2.csv / museum_3.csv (0) | 2021.07.21 |
| #15. albums.csv (0) | 2021.07.21 |
| #14. salaries.csv (0) | 2021.07.20 |

